DICOM SEG
Displaying DICOM Segmentation
Since Weasis Version4.3.0, this panel lets you display the contents of a DICOM SEG file superimposed on the image. It also lets you modify the transparency of specific regions (label defined by a color).
DICOM SEG can be generated by AI frameworks to represent the results of segmentation algorithms applied to medical images.
How to display DICOM SEG
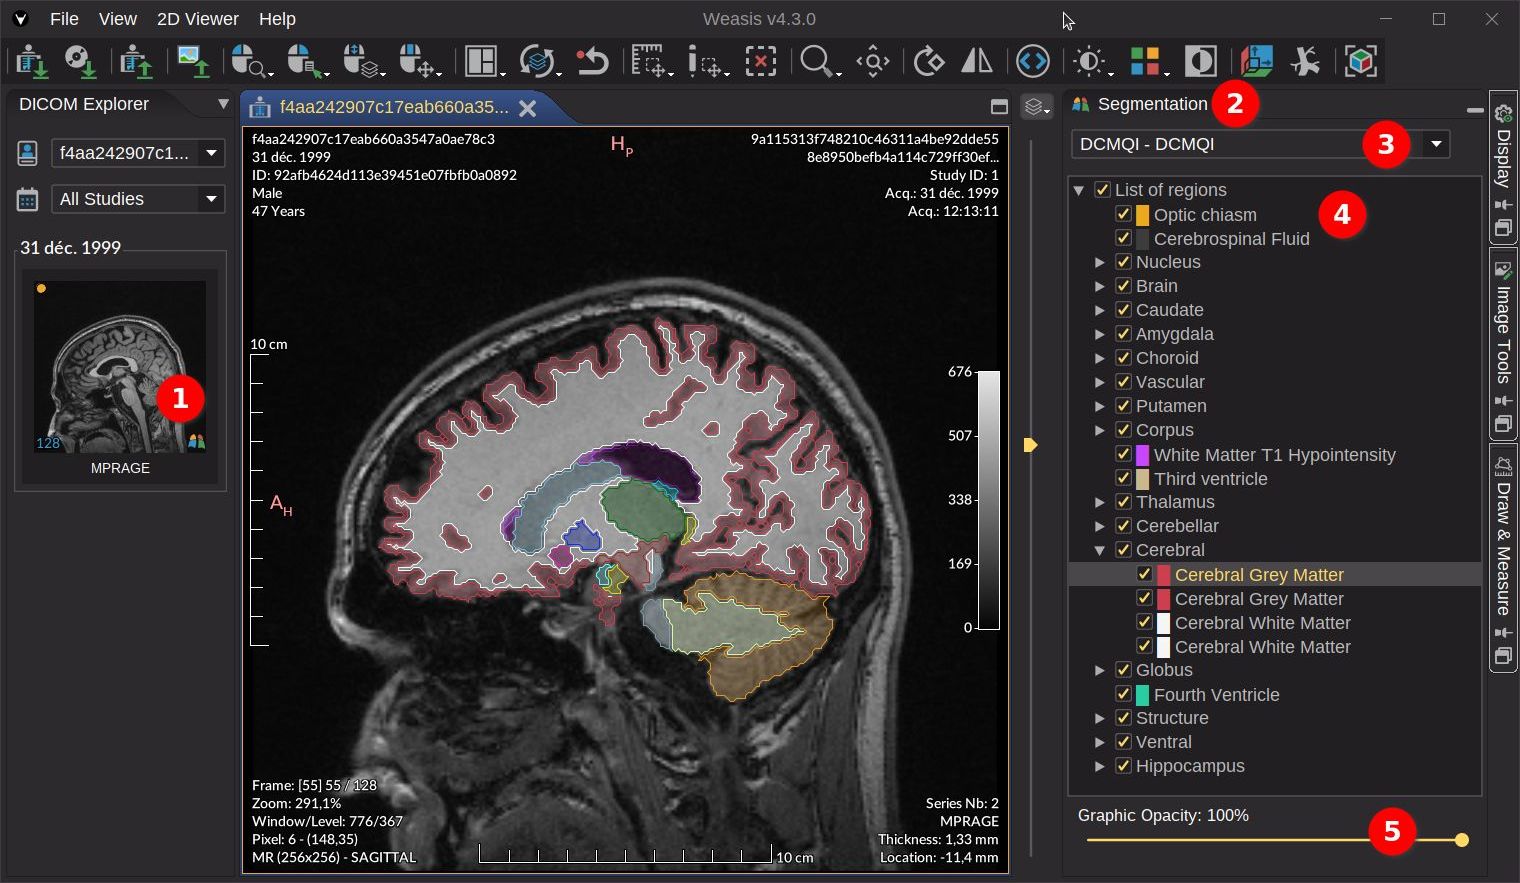
In order to display the DICOM SEG regions in overlay on the image, follow these steps (see in the image below):
- Open the DICOM series with a link to a DICOM SEG object. This link is visible by the segmentation icon in the lower right-hand corner of the thumbnail.
- Once the image is displayed, you can click on of the vertical button to show the Segmentation panel on the right side of the viewer.
- A DICOM SEG file is represented by a selected item in the combo box and its list of regions below. By default, all DICOM SEG files linked to an image are displayed.
- Select one or several regions to display for the selected DICOM SEG (3). Several regions are grouped together when they share the same first name. Note: the parent node must be selected to display the child regions.
- Adjust global graphic opacity (border and interior)
Note
The regions tree has context menus that allow you to:
- Fill opacity (all nodes): The opacity of the interior of the shape, relative to the opacity of the line color (Graphic Opacity). The default value is 20%. For example, if the line color has an opacity of 80% and the fill opacity is 20%, then the perceived opacity will be 16% (0.8 * 0.2).
- Select/Unselect all the child nodes (only for parent nodes)
- Show ih the images view (only for leaf nodes): The region with the highest surface area is displayed in the image overview.
- Pixel statistics from the selected view (only for leaf nodes): Show statistics of the pixel values within the region shape. For the definition of the statistics parameters, see graphic Pixel Statistics.
Tip
The regions tree has tooltips on leaf elements that show the region description and the region volume.