Draw & Measure
How to draw and measure on images
This panel allows you to draw and measure on DICOM and standard images. The results can be exported:
- For DICOM, in a DICOM Presentation State object.
- For standard images, in an XML File in the same directory of the image (when exporting the images in non dicom file format). The XML file is automatically loaded when the image is displayed in the standard 2D Viewer.
Draw & Measure Panel
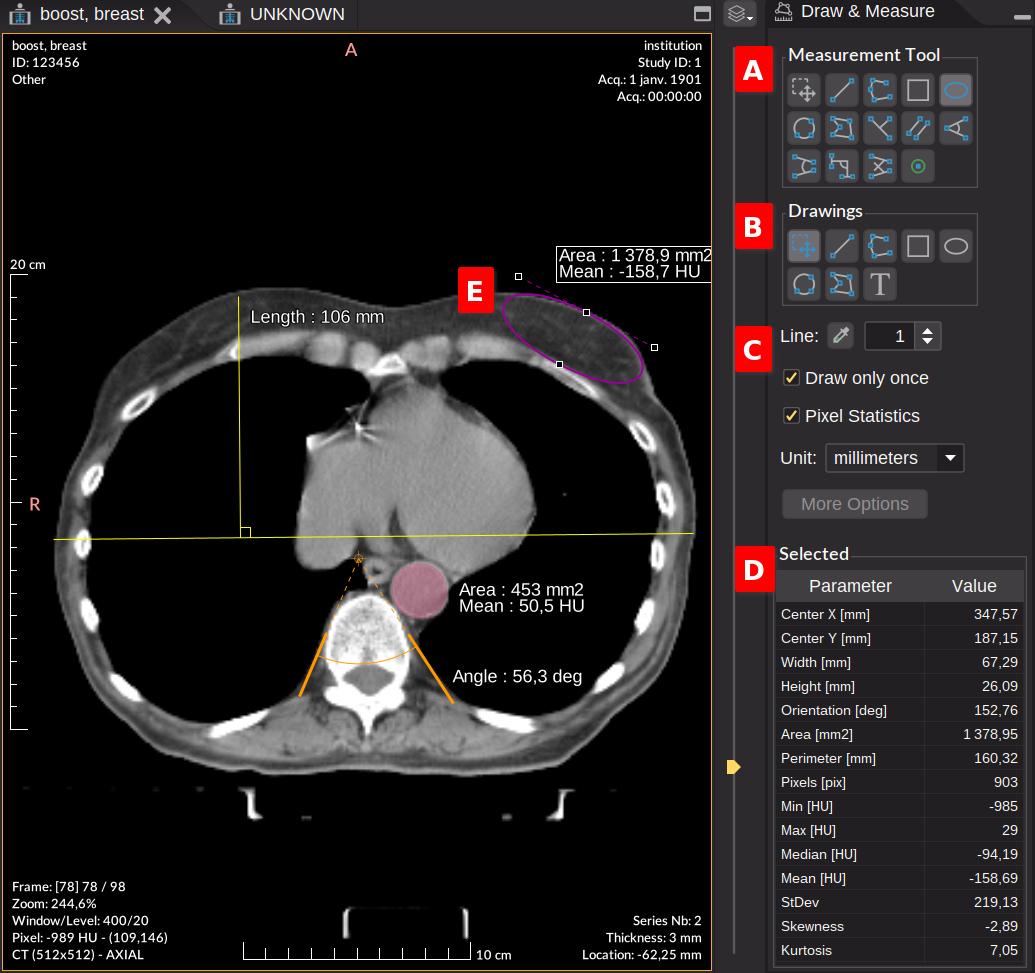
When clicking on of the vertical button , the panel is displayed on the right side of the viewer. This panel is divided into 4 parts.
Measurement tools A
Select a measurement tool by clicking on one of the buttons and then draw on the image. Note that the previous action will select automatically the drawing action in the mouse left button.
The first button is the selection tool that allows you to select, resize and move the graphic objects.
By selecting one or several graphic objects, you can change properties (e.g. color, line width) or copy/paste with the contextual menu. You can also delete the selection with the delete key or . See other shortcuts for graphics.
There are two ways to draw a segment:
- Click + drag > release
- Click > release > drag > release
In order to continue drawing with the same tool, you can uncheck the Draw only once option (see below).
For a polyline or polygon, double-click to complete editing. You can also delete a point or add new ones by right-clicking on a specific point.
Rectangles and ellipses can be drawn in any direction. External control points can be used to rotate and resize the shape. With the single control point on the opposite side, you can only resize the shape.
Drawings B
The drawing buttons allow you to add text and graphic as annotations. These graphics objects do not display measurement values and do not appear in Selected Measurement D.
Graphic Options C
- Line color: The default line color when drawing new graphic object. The default value is yellow. The opacity can be changed from the transparency or alpha slider of the different color models in the color picker.
- Line width: The default line width.
- Draw only once: After drawing a graphic object, the tool is automatically set to the selection mode. If unchecked, the tool remains active for drawing a new graphic.
- Pixel statistics: Show statistics of the pixel values within the shape. Only for graphic objects with a closed shape (e.g. rectangle, ellipse, polygon).
- Unit: The unit of the image spatial calibration. If no calibration is defined, the unit is pixel. See also How to change the spatial calibration.
- More options: The preferences to change more display options (see preferences).
Show/hide all the graphic objects from the Display panel by checking/unchecking the Drawings option.
Selected Measurement D
The selected graphic E created with a measurement tool is displayed in the table. The table shows the shape properties according to the measurement type (and its units in square brackets if exists).
For polygon, the length, the width and the orientation are calculated with OMBB (Offset Minimum Bounding Box) method which provides a more accurate approximation of the actual length and width based on the bounding box of the polygon.
When Pixel statistics is checked, some statistics are displayed in the table only for graphics with a closed shape (e.g. rectangle, ellipse, polygon). The statistics are calculated from the pixels inside the graphic shape:
- Pixels: The number of pixels inside the graphic shape
- Min: The minimum modality value
- Max: The maximum modality value
- Median: The median modality value
- Mean: The mean modality value
- StDev: The standard deviation is a measure of the dispersion of the values
- Skewness: The skewness is a measure of the asymmetry of value distribution
- Kurtosis: The kurtosis is a measure of the “tailedness” of value distribution
SUV (Standardized Uptake Value) measurements are added to the table only for PET images containing the required metadata (patient weight,Decay Correction, radio pharmaceutical dose and time…).
The SUVs (the minimum, maximum, and average values) are calculated using the body weight (SUVbw) vendor-neutral method.
The table can be exported by copy/paste. Note that the maximum precision values are copied and not the rounded values displayed in the table.
Preferences
From the menu “File > Preferences > Draw & Measure”:
Drawings
It lets you change the graphic properties when drawing new graphics, since Version4.3.0.
- Line color: The default line color. The default value is yellow. The opacity can be changed from the transparency or alpha slider of the different color models in the color picker.
- Line width: The default line width.
- Fill shape: When checked, the shape is filled with the line color.
- Fill opacity: The opacity of the interior of the shape, relative to the opacity of the line color. The default value is 100%. For example, if the line color has an opacity of 80% and the fill opacity is 20%, then the perceived opacity will be 16% (0.8 * 0.2).
Labels on image
It lets you change the display options for labels attached to measurement graphics.
- Font type: The default font size of the labels on the image. The default value is Small semibold. Note that the font size is not absolute and is automatically adjusted according to the scale factor.
- Geometric measurement: the measurement types displayed on the image according the graphic type.
- Pixel statistics: the statistics types displayed on the image for graphic objects with a closed shape (e.g. rectangle, ellipse, polygon).