Histogram
Displaying Histogram
Displaying the histogram allows you to view the distribution of the modality values.
Displaying the histogram allow you to better understand the effect on the pixel distribution wen changing all the LUT parameters from the Image Tool right panel.
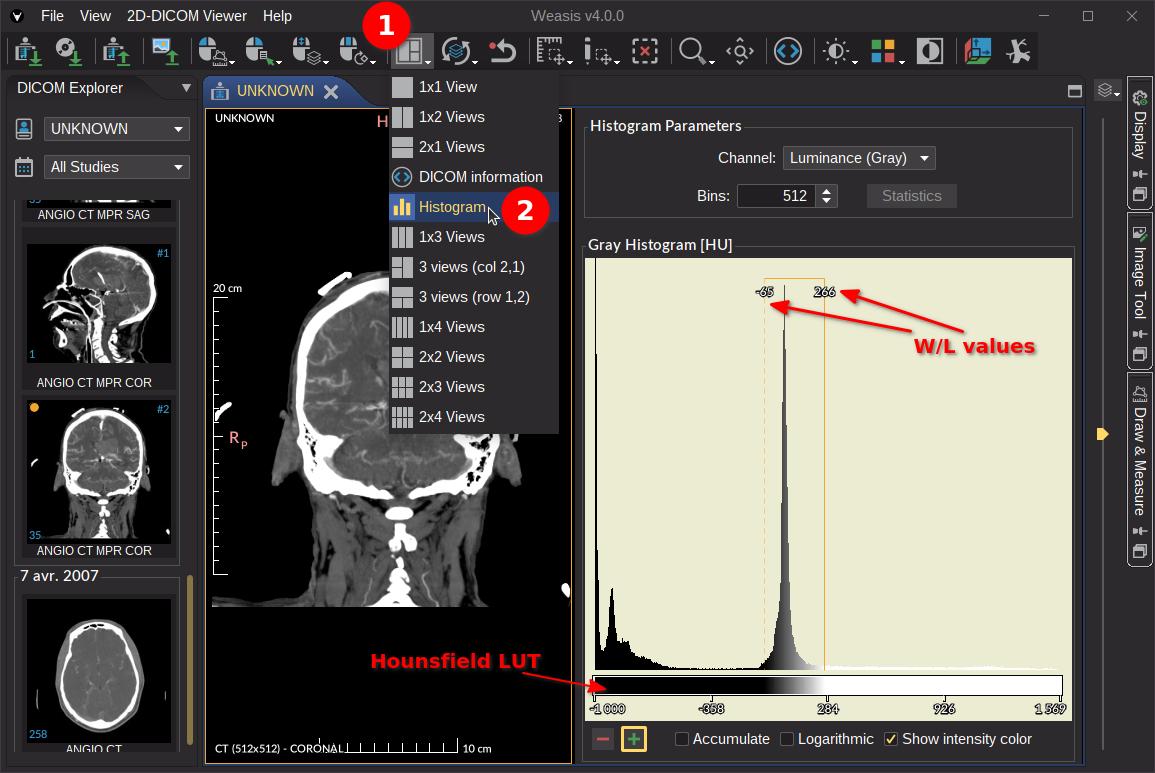
To open the histogram, select the “Histogram” layout from the Layouts dropdown button (see the image below).
General histogram parameters:
- Channel: With gray images only the Luminance channel is available. With color images, you can choose one of the following color models: RGB, HSV and HLS.
- Bins: The bins are the intervals values of pixels. By default, this number is calculated by the max value minus the min value and cannot exceed 512. The value entered must be between 64 and 4096.
- Statistics: Show the statistics of the histogram which allow you to analyze and to compare images or image regions in a quantitative way. For the definition of the statistics parameters, see graphic Pixel Statistics.
The values on the x-axis represent the modality values (e.g. Hounsfield for CT) or the pixel values for some imaging types. If the unit of the pixel value of the modality exists, it is visible at the end of the histogram title.
Display histogram parameters:
- -/+: shrink/strech the y-axis scale (the number of occurrences)
- Accumulate: Display a cumulative histogram
- Logarithmic: Show the number of occurrences in a logarithmic scale (y-axis).
- Show intensity color: Show the bin with the LUT colors, otherwise in black.
- Reset: Set the default parameters
It is possible to display the histogram of a region with the measurement tools. Simply select the region to display its histogram (see the image below).
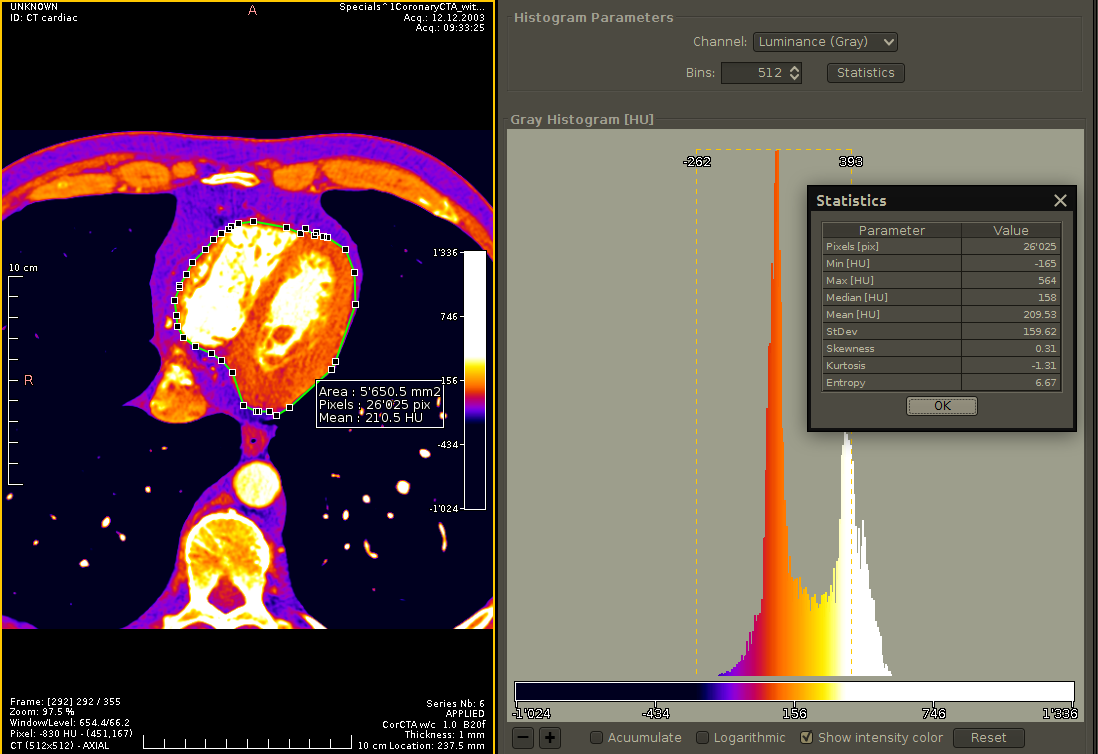
Clicking on the histogram bin allows displaying the number of occurrences and the modality range values of the selected bin.