Image Fusion
Image Fusion
Image fusion overlays a functional series — PET (PT) or SPECT (NM) — on top of an anatomical CT or MR base, so metabolic uptake can be read against the underlying anatomy. The overlay is a registration-free geometric fusion: Weasis aligns the two series from their DICOM spatial metadata alone, with no manual or algorithmic registration step. Available since Version4.7.1.
Note
Fusion is a pure spatial overlay driven by each image’s position in the patient coordinate system. It does not deform or re-register the images, so it is only offered when the two series are genuinely co-located (see Requirements below).
Requirements
A series can be fused onto the displayed base only when all of the following hold:
| Condition | Detail |
|---|---|
| Modality pairing | A functional overlay (PT, NM) on an anatomical base (CT, MR). |
| Same study | Both series share the same StudyInstanceUID. |
| Volume geometry | Both are cross-sectional volumes (≥ 2 slices with Image Position / Orientation Patient and Pixel Spacing). |
| Same coordinate system | Either the FrameOfReferenceUID matches, or — as is common for separately reconstructed PET/CT — the two volumes overlap in patient space. |
When no compatible overlay is found in the study, the fusion controls stay disabled.
Enable fusion
The fusion controls live in the Fusion section of the Image tool panel. The section is collapsed by default — click its header to expand it.
- Enable Fusion — turns the overlay on or off. The other controls become active only while fusion is enabled.
- Series — the functional series to overlay. The list contains every compatible overlay found in the current study (see Requirements).
- LUT — the color lookup table applied to the overlay. PET (a hot-metal palette tuned for functional data) is selected by default. The values are mapped to it through a series-wide display window, not through the window/level of the functional series.
- Opacity — two sliders control the blend at composite time:
result = baseOpacity·base·(1 − a) + overlay·a, whereais the overlay’s own transparency at that pixel — it grows with the value and reaches the Opacity setting within the lower tenth of the display window, so background stays invisible while everything above it is blended at the chosen opacity. Each slider is labelled with the modality of the layer it controls (e.g. CT for the base, PT for the overlay). Defaults are 100 % base and 50 % overlay. Setting the base to 0 % leaves the colorized overlay alone over a black background.
The overlay follows the base view as you scroll, zoom, window, or reslice it. Because the fusion is resampled from the functional volume, it stays correct on oblique, coronal and sagittal planes, not only the native acquisition plane.
Note
The Reset action turns fusion off and returns to the plain base image, like any other display setting it restores.
Display window and color scale
Available since Version4.7.2.
The overlay is mapped to its LUT through a window derived from the whole functional series, so a given uptake keeps the same color on every slice. It is measured from the data and has no control in the interface:
| Overlay | Window |
|---|---|
| PET whose SUV factor can be computed | 1 SUVbw to the next whole SUVbw above the series maximum, kept between 4 and 30. |
| Any other overlay | 0 to the series maximum, in the raw DICOM pixel value unit. |
The upper bound is a high percentile of the active voxels rather than the plain maximum: physiologic excretion (bladder) and the injection site are several times hotter than any diagnostic structure, so they saturate at the top of the palette instead of pushing the rest of the study into its first tenth. The lower bound is where the overlay starts being visible — below it the base image is left untouched, which is why normal tissue does not tint the anatomy.
The resulting scale is drawn as a color bar on the fused view, beside the LUT bar of the base image when both are shown:
- The value at the top of the bar is the window maximum, the one at the bottom its minimum.
- The unit written above it is
SUVbwwhen SUV could be computed, the DICOM pixel value unit (BQML,CNTS, …) otherwise, or a percentage of the window when the series carries no unit. OnlySUVbwvalues can be compared with another acquisition: the others depend on the injected dose, the patient weight and the uptake time. - The band the overlay paints as fully transparent is left blank, so the activity that is deliberately not shown reads as such instead of being mistaken for a color.
The bar is toggled with Fusion Color Scale in the Display panel and is enabled by default. It is not drawn on views shorter than 350 pixels, where it would overlap the corner annotations.
SUV statistics on a region of interest
When the overlay is a PET series carrying the required metadata, a closed measurement drawn on the fused base image also reports the overlay’s SUV values inside the region — Min, Max and Mean, in SUVbw, g/ml. These rows are sampled from the original PET voxels (no resampling loss on the maximum) and are tagged with the overlay’s modality — for example Max (PT) — so they read alongside the base-image statistics.
Tip
SUV is computed with the body-weight method (SUVbw), following the vendor-neutral QIBA definition. The same values can be read directly on the PET series itself — see SUV measurements.
Fusion in the MPR viewer
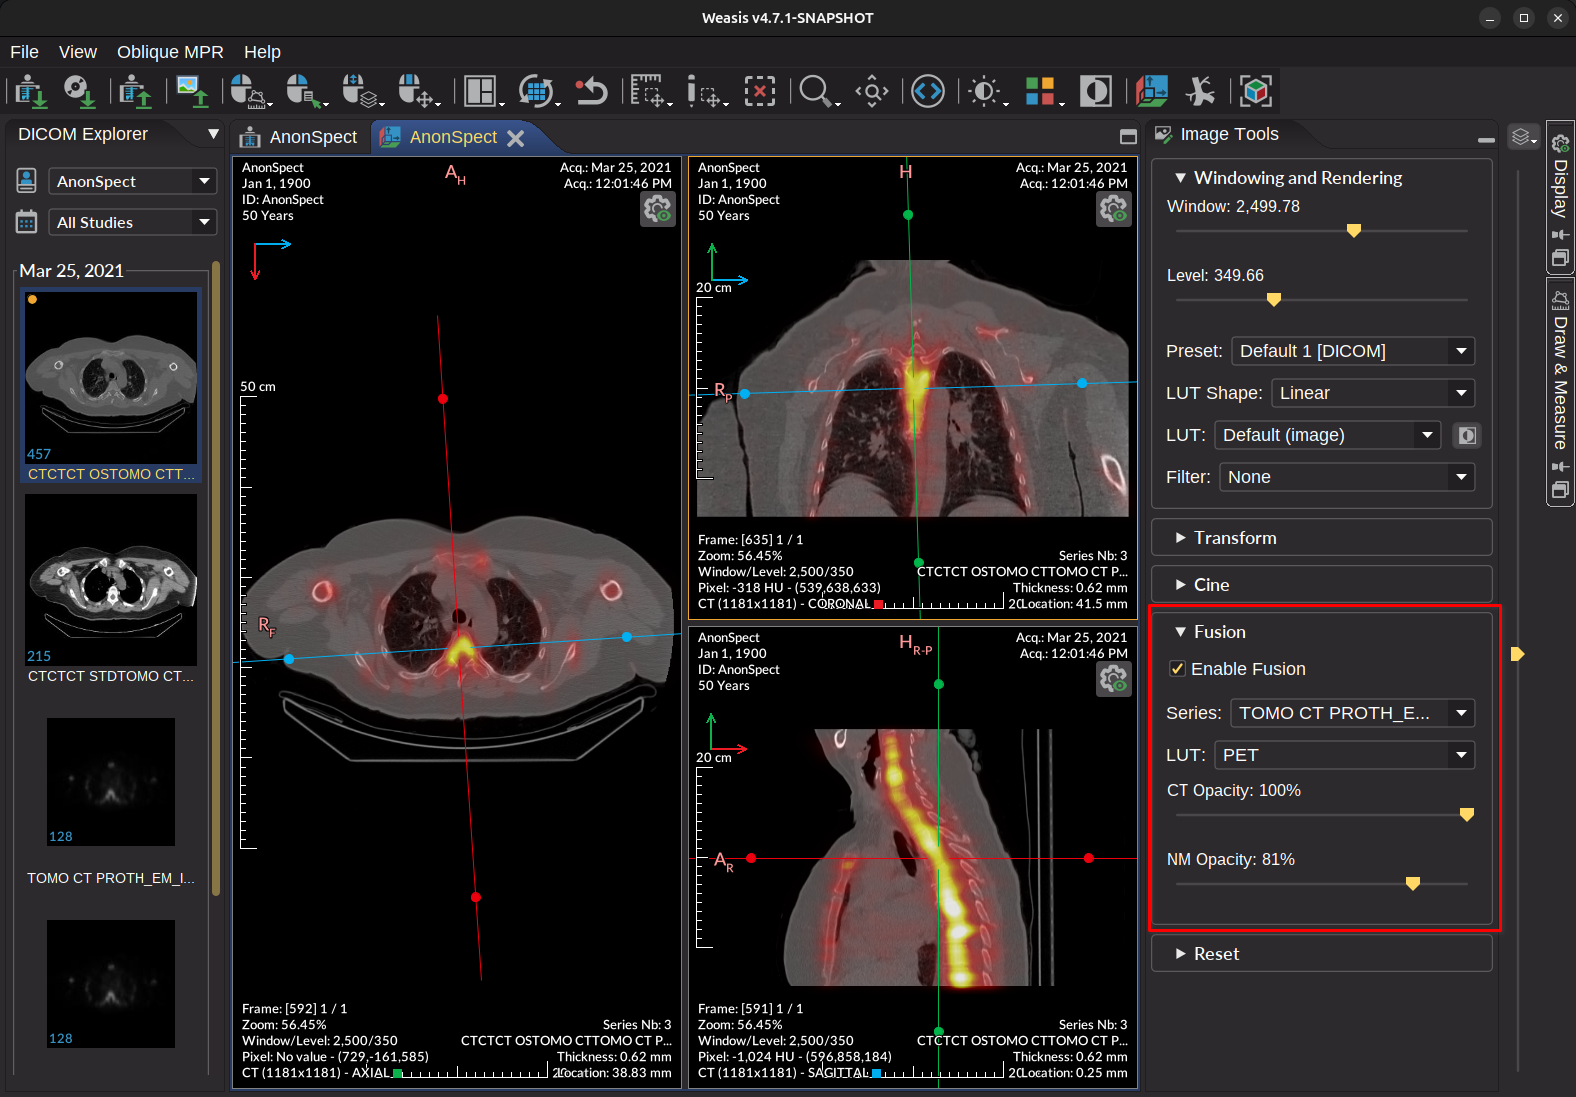
Opening the MPR viewer from a fused 2D view carries the fusion over: the three MPR planes start with the same overlay series, LUT and opacities you set in the 2D view. Each plane keeps its own fusion settings, so you can fine-tune — or disable — the overlay independently per plane afterwards, without affecting the 2D view or the other planes.
Note
Inheritance only applies when the overlay is still compatible with the reconstructed MPR base. If you open MPR from a non-fused view, the planes start with fusion off, and you can enable it from the same Fusion section as in the 2D viewer.
See also
- DICOM 2D Viewer — the base viewer hosting the Image tool.
- View Synchronization — displaying a PET and its CT side by side instead of overlaid.
- Draw & Measure — SUV and other measurements.
- MPR Viewer — multiplanar reconstruction.