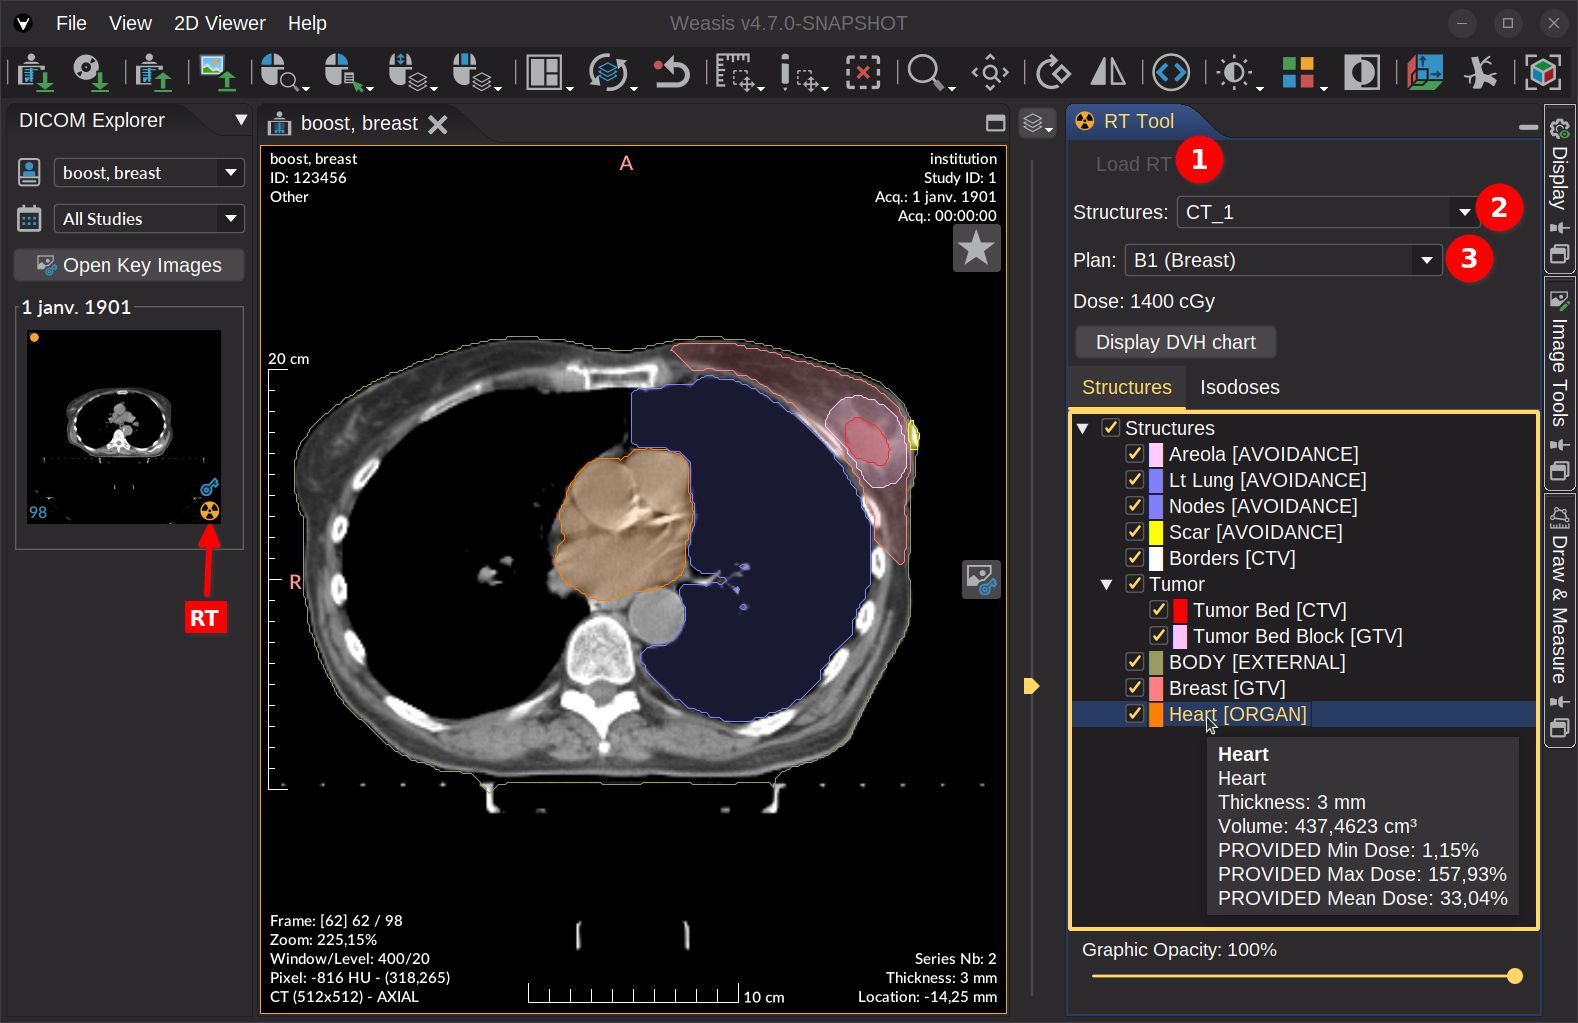
DICOM RT Tools
Displaying radiotherapy information
Radiotherapy treatment data is distributed across three companion DICOM objects:
- RTSTRUCT — contoured structures (target volumes, organs at risk, body outline) referenced to a planning CT.
- RTPLAN — prescribed dose, fractionation, beam geometry, and machine setup.
- RTDOSE — the computed dose distribution as a 3D pixel grid, with optional pre-computed DVH histograms.
When a CT series is loaded together with its associated RTSTRUCT, RTPLAN, and RTDOSE files, Weasis automatically links them and the RT Tool appears in the right panel.
How to display structures
- Click Load RT to load the linked DICOM STRUCT, PLAN, and DOSE objects. The button becomes inactive once loading completes.
- InfoOptional Select a structure set if more than one is available.
- InfoOptional Select a plan if more than one is available.
Try to open an RT sample
Note
The region tree exposes a context menu with the following actions:
- Select / unselect all child nodes (parent nodes only) — toggle visibility for every sub-region in a group at once.
- Fill opacity — controls the transparency of the region’s interior relative to its border.
- Default value: 20%
- Perceived opacity = Line opacity × Fill opacity
- Example: 80 % line + 20 % fill → 16 % perceived interior opacity.
- Export to clipboard as CSV — copies region data (volume measurements, dose calculations) for analysis in spreadsheets or external tools.
- Pixel statistics from the selected view (leaf nodes only) — computes statistical descriptors of pixel values inside the region. For the parameter definitions, see Pixel Statistics.
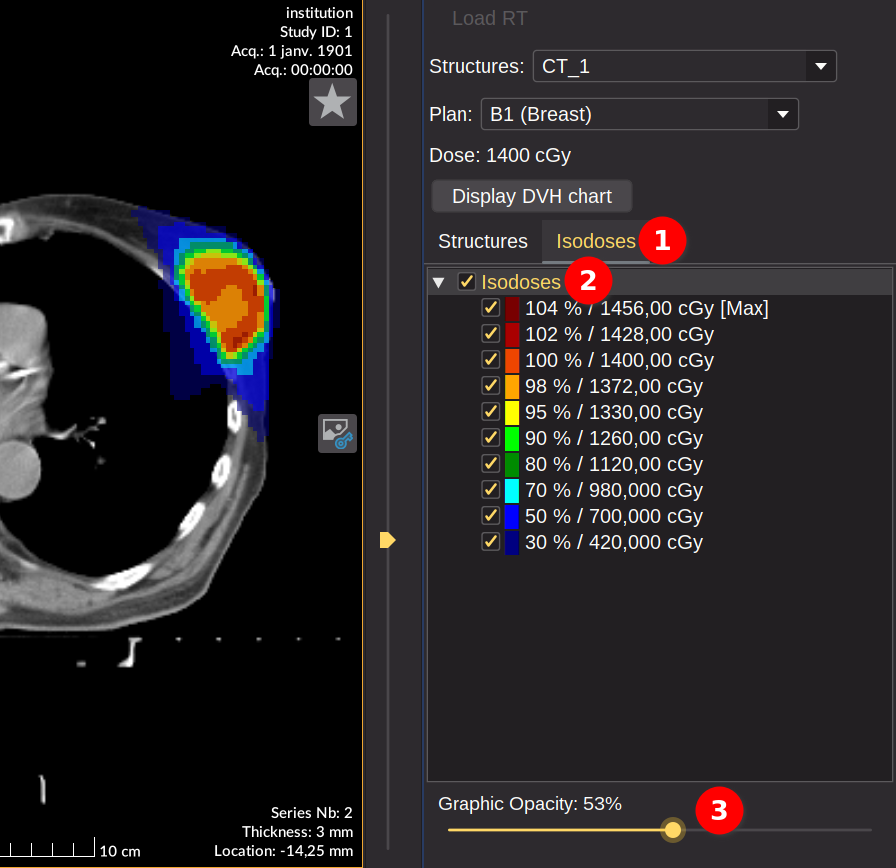
How to display isodoses
- Switch to the Isodoses tab.
- Check the Isodoses root node — it is unchecked by default.
- InfoOptional Adjust the graphic opacity (default: 50 %).
Tip
The Structures and Isodoses root nodes act as master switches — toggle them to show or hide all overlays at once, while child nodes keep individual control over specific items.
Note
Since Version4.7.0 the isodose overlay is rendered directly from the RTDOSE pixel grid (resampled to the CT image grid using nearest-neighbor interpolation) instead of vector contours. This provides a more faithful representation of the dose distribution stored in the DICOM file, especially around steep dose gradients.
How to display the DVH chart
The Dose-Volume Histogram (DVH) summarizes, for each selected structure, the fraction of its volume that receives at least a given dose level — the standard way to compare plans and check organ-at-risk constraints.
- Select one or several structures (the Structures root node must also be selected).
- Click Display DVH chart.
- Right-click on the chart to print or save as PNG, or as a vector file (SVG, EPS).
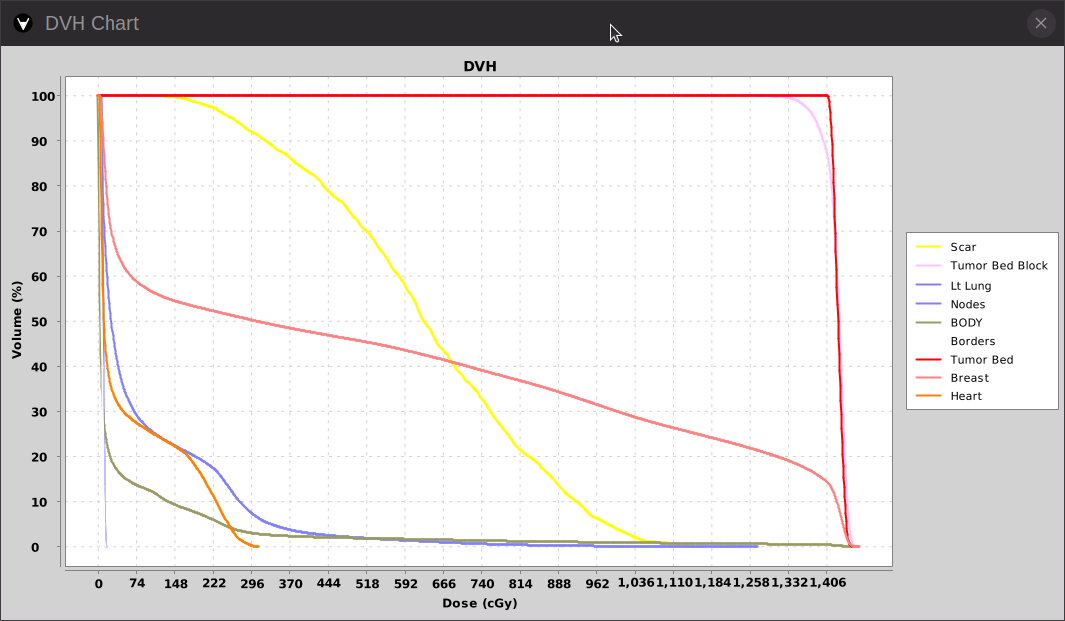
Warning
Since Version4.7.0, when one or more selected structures have no DVH stored in the RTDOSE, a confirmation dialog lists the affected structures and offers to compute the missing histograms on the fly.
The calculation algorithm (derived from dicompyler) is experimental and not clinically validated: results must not be used for medical decisions. The feature can be disabled by setting the system preference weasis.rt.dvh.recalculate.enable to false; when disabled, only DVHs already stored in the RTDOSE are displayed.