Draw & Measure
How to draw and measure on images
The Draw & Measure panel lets you annotate and measure on DICOM and standard images — distances, angles, areas, regions of interest, free-hand shapes, and text labels. Measurement values are computed from the image’s spatial calibration when available, and from pixel statistics when the shape is closed.
Where the results are persisted depends on the image type:
- For DICOM images — saved into a DICOM Presentation State (GSPS) object that travels with the study.
- For standard images — saved into an XML file in the same directory as the image (when the image is exported in a non-DICOM format). The XML file is loaded automatically the next time the image is opened in the 2D viewer.
Draw & Measure Panel
Click on the vertical button to dock the panel on the right side of the viewer. The panel is divided into four parts:
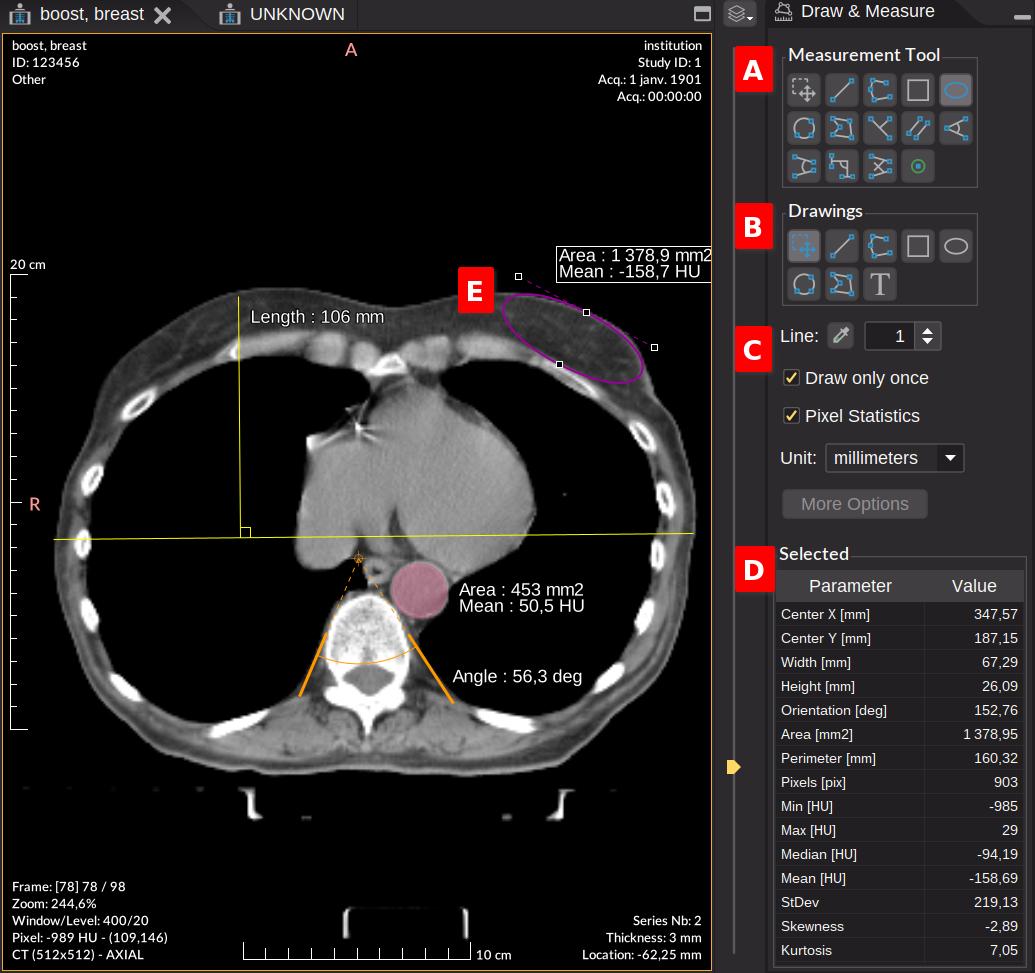
Measurement tools A
Click a measurement tool and then draw on the image. Picking a tool here also becomes the active action on the left mouse button.
The first button is the selection tool — used to select, resize, and move existing graphic objects.
Once one or more graphics are selected, you can change their properties (color, line width…) or copy/paste them through the right-click menu. The selection can be removed with the Delete key or . See the full list of graphic shortcuts. A confirmation dialog is shown before the deletion; it can be disabled from its Don’t ask me again checkbox or the Draw & Measure preferences.
Note
A segment can be drawn in two equivalent ways:
- Click + Drag — click, drag to draw, release.
- Click > Release > Drag — click to set the start point, release, drag to draw, click again to set the end point.
To keep the same tool active for several draws in a row, uncheck Draw only once (see Graphic Options).
Tip
For a polyline or polygon, double-click to finish editing. Right-clicking a vertex offers add / delete actions on that specific point.
Rectangles and ellipses can be drawn at any angle. The external control points rotate and resize the shape; the single control point on the opposite side resizes only.
Drawings B
The drawing buttons add text and graphic annotations. These objects are purely decorative — they do not display measurement values and do not appear in the Selected Measurement table.
Graphic Options C
- Line color — default color for new graphics (default: yellow). The transparency / alpha slider in the color picker controls opacity.
- Line width — default line width.
- Draw only once — when checked, the tool reverts to the selection mode after each draw. Uncheck to keep the same tool active for successive draws.
- Pixel statistics — compute and display statistics of the pixel values inside the shape. Only meaningful for closed shapes (rectangle, ellipse, polygon).
- Unit — unit of the image’s spatial calibration. When the image has no calibration, the unit falls back to pixels. See How to change the spatial calibration.
- More options — opens the Draw & Measure preferences for the deeper display options.
Tip
All graphics can be shown or hidden at once from the Display panel by checking or unchecking the Drawings option.
Selected Measurement D
The graphic E currently selected on the image is summarized in this table. The reported properties depend on the measurement type, with units shown in square brackets when present (see the calibration type at M).
Note
For polygons, length, width, and orientation are computed with the OMBB (Oriented Minimum Bounding Box) method — a tighter bounding box than the axis-aligned one, giving a more accurate approximation of the polygon’s real dimensions.
When Pixel statistics is checked, the table also reports descriptors computed from the pixels enclosed by the (closed) shape:
- Pixels — number of pixels inside the shape.
- Min — minimum modality value.
- Max — maximum modality value.
- Median — median modality value.
- Mean — mean modality value.
- StDev — standard deviation; a measure of how dispersed the values are.
- Skewness — asymmetry of the value distribution.
- Kurtosis — “tailedness” of the value distribution.
Note
SUV (Standardized Uptake Value) measurements are added to the table on PET images when the required metadata is present (patient weight, decay correction, radiopharmaceutical dose, acquisition time, …). Min / Max / Mean SUV are computed with the body-weight method (SUVbw), following the vendor-neutral QIBA definition.
Tip
The table can be exported by copy / paste. The copied values use the full numerical precision, not the rounded values shown on screen.
Preferences
From the main menu File > Preferences > Draw & Measure.
- Ask for confirmation before deleting a drawing — when checked (default), a confirmation dialog is shown before deleting the selected graphics. Unchecking it (or ticking Don’t ask me again in that dialog) deletes them without confirmation — since Version4.7.1.
Drawings
Default graphic properties applied when drawing new objects — since Version4.3.0.
- Line color — default color (default: yellow). The transparency / alpha slider in the color picker controls opacity.
- Line width — default line width.
- Fill shape — when checked, the interior of the shape is filled with the line color.
- Fill opacity — opacity of the interior, relative to the line color’s opacity. Default: 100 %. Example: line opacity 80 % × fill opacity 20 % → perceived interior opacity 16 %.
Labels on image
Display options for the labels attached to measurement graphics.
- Font type — default font size for the on-image labels (default: Small semibold). The size is not absolute — it adjusts automatically with the interface scale factor.
- Geometric measurement — which geometric measurements are displayed on the image for each graphic type.
- Pixel statistics — which pixel statistics are displayed on the image for closed shapes (rectangle, ellipse, polygon).