DICOM SEG
Displaying DICOM Segmentation
DICOM Segmentation (SEG) stores pixel-based labels — anatomical structures, lesions, organs at risk — as a separate object that references a source image series. It is the standard delivery format for AI segmentation frameworks, but also for manual or semi-automatic contouring tools.
Weasis displays SEG regions as a colored overlay on the source images, with independent visibility and opacity control per region. Available since Version4.3.0; significantly extended in Version4.7.0 with:
- Overlays in MPR and 3D Volume Renderer views, in addition to the standard 2D viewer.
- Simultaneous display of all SEG files linked to the current series, each toggleable independently.
- Support for the FRACTIONAL (probability / occupancy maps) and LABELMAP (multi-segment files used by tools like highdicom) segmentation types produced by modern AI frameworks.
- The same smooth fractional overlay reused for RT Dose isodose rendering — see the RT tutorial.
How to display DICOM SEG in the 2D viewer
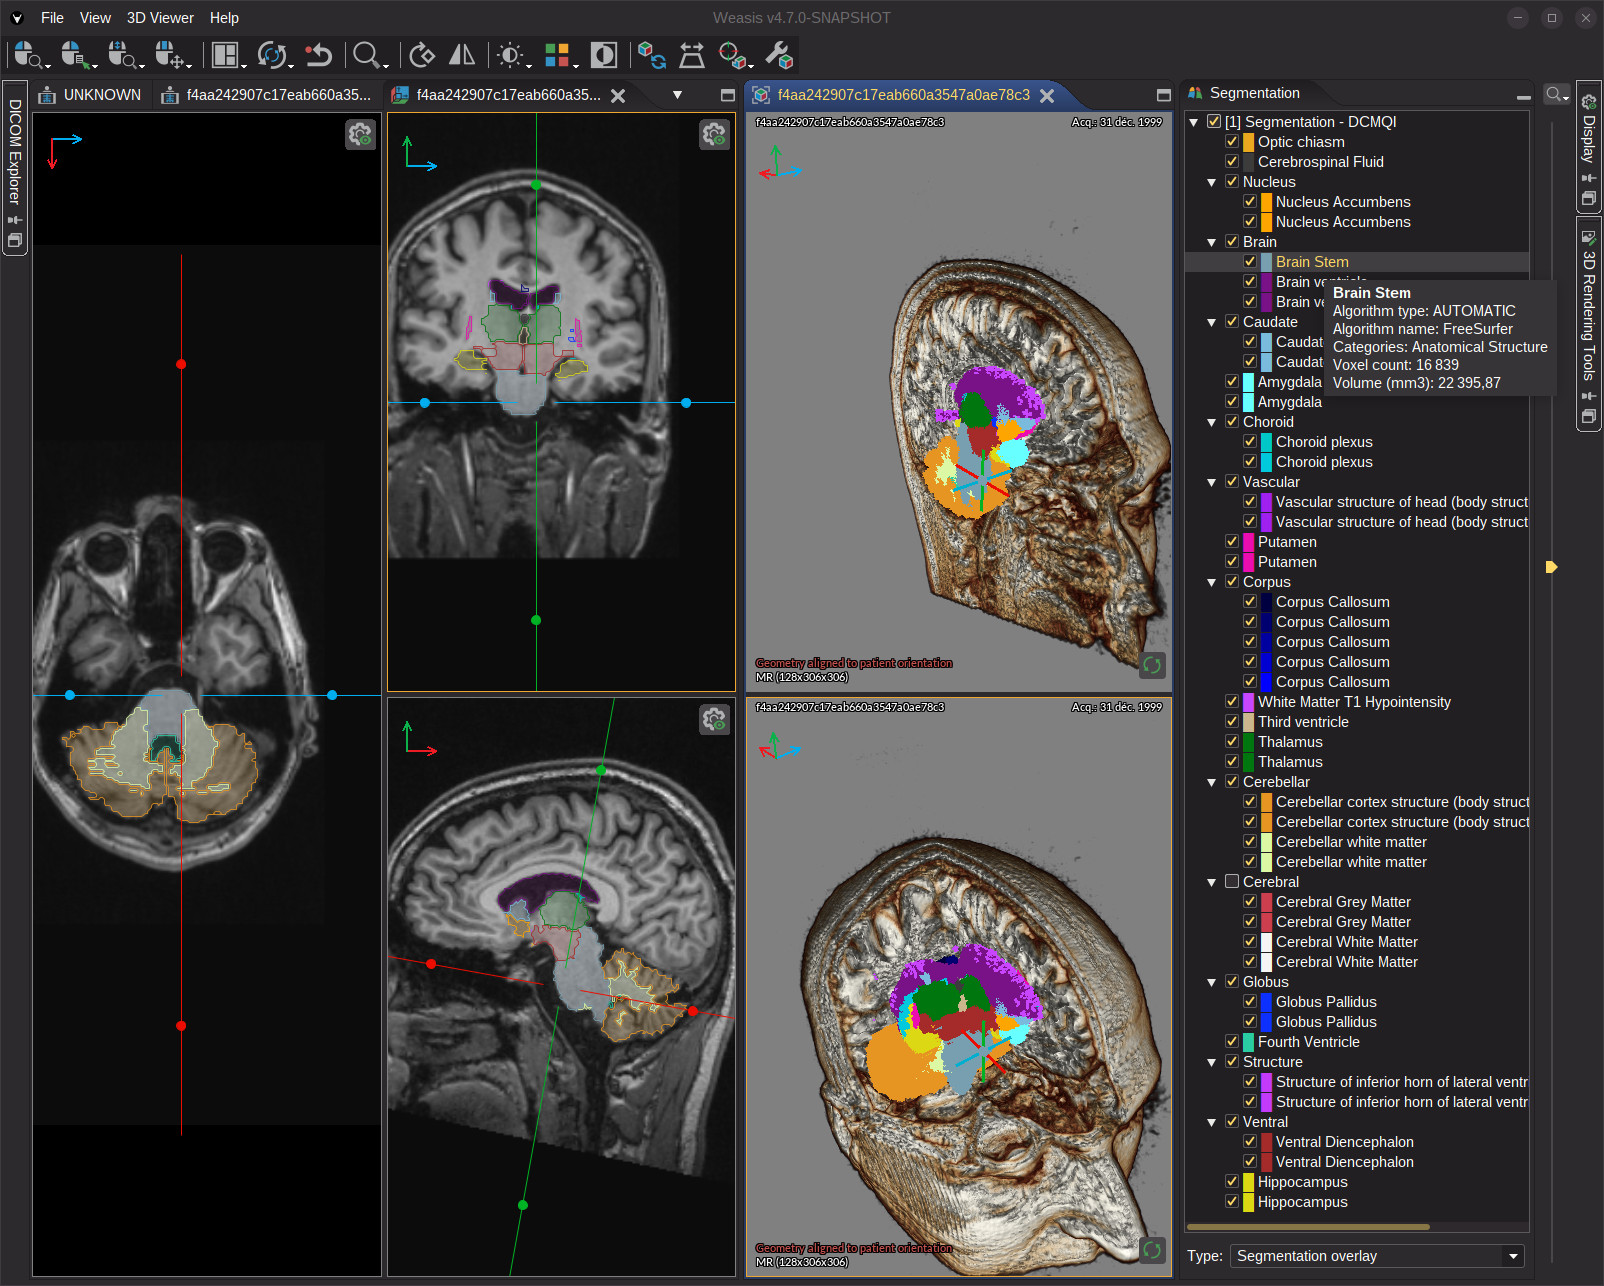
To display the SEG regions as an overlay on the image, follow these steps (see the image below):
- Open a DICOM series that has a linked SEG object. The link is indicated by the segmentation icon in the lower-right corner of the thumbnail.
- Once the image is displayed, click on the vertical button to open the Segmentation panel on the right side of the viewer.
- Every SEG file linked to the current series appears as a top-level node in the tree. Expand a SEG node to reveal its regions and tick the ones you want to display. Regions that share a common name prefix are grouped under a parent node — the parent must be checked for any of its children to be visible.
- InfoOptional Adjust the global graphic opacity (border and interior fill) with the slider.
- InfoOptional Use tooltips to see the region description, voxel count and estimated volume for each region. For FRACTIONAL regions a color-gradient bar is also displayed to help interpret the probability ramp.
Try to open a SEG sample

Note
Right-click on a region in the tree to access:
- Select / unselect all child nodes (parent only) — toggle visibility for every child region at once.
- Fill opacity — transparency of a region’s interior relative to its border.
- Default: 20 %
- Perceived opacity = Line opacity × Fill opacity
- Example: 80 % line + 20 % fill → 16 % perceived interior opacity.
- Show in the image view (leaf only) — jumps to the slice where the region has its largest cross-section.
- Pixel statistics from the selected view (leaf only) — computes statistical descriptors of pixel values inside the region. For the parameter definitions, see Pixel Statistics.
Note
Loading a DICOM SEG. The first time a SEG is shown — in the 2D viewer, MPR or 3D — Weasis decodes it in the background. Scrolling and other interactions remain responsive while decoding runs; the regions appear as soon as the SEG is ready.
A cancelable progress entry is shown at the bottom of the DICOM Explorer, so a large or slow SEG can be canceled without blocking the rest of your work.
Once decoded, the SEG is shared between the 2D, MPR and 3D views — loaded only once even with several views open. Weasis may release it automatically when memory gets tight and reload it on demand the next time it is needed.
Supported segmentation types
Weasis supports all three DICOM SEG segmentation types:
| Type | What it represents | How Weasis displays it |
|---|---|---|
| BINARY | Each pixel is either inside or outside the segment. | Colored contour drawn on the image. |
| FRACTIONAL — PROBABILITY | Each pixel carries a value between 0 and 1 expressing how confident the AI is that the pixel belongs to the segment. | Smooth colored overlay: more transparent where confidence is low, more opaque where it is high. The opacity slider scales the whole gradient. |
| FRACTIONAL — OCCUPANCY | Each pixel carries a value between 0 and 1 expressing how much of the pixel is actually covered by the segment (partial-volume fraction). | Same smooth overlay as PROBABILITY — only the meaning of the value differs. |
| LABELMAP | Several segments are packed into a single image, with the pixel value identifying which segment it belongs to. | Each segment is extracted automatically and drawn with its own color. |
Note
Some AI frameworks export FRACTIONAL segmentations without an explicit reference back to the source series. Weasis matches them to the correct images automatically (via the DICOM frame of reference).
Segmentation overlay in MPR
When a DICOM SEG is linked to the current series, the overlay is automatically available in the Multi-Planar Reconstruction (MPR) view. The same Segmentation panel controls visibility and opacity for all three planes (axial, coronal, sagittal — plus any oblique cut) at once.
For MPR, Weasis additionally has to reslice the SEG along the new planes. This extra step runs in the background; the overlay appears on every plane as soon as it completes.
Tip
The MPR overlay works even when the SEG has a different orientation, spacing or scanning direction than the source images — for example an AI model that segments at a coarser resolution. Weasis reprojects the mask into the image coordinate system, so contours stay aligned on every plane.
Segmentation overlay in the 3D Volume Renderer
The 3D Volume Renderer offers three segmentation modes, selectable from the Segmentation panel:
| Mode | What it shows |
|---|---|
| No segmentation | Volume rendering only — no overlay. |
| Segmentation only | Only the labeled regions are rendered; the anatomy is hidden. Useful to review the AI output on its own. |
| Segmentation overlay | Regions are drawn on top of the volume rendering, with the anatomy remaining visible beneath. |
A few things to keep in mind when working with the 3D overlay:
- Toggling a segment is instant. Visibility, color and opacity changes update the 3D view immediately, even on very large volumes — Weasis only refreshes the color table, not the segmentation itself.
- Overlapping segments are handled cleanly. When two segments share the same area, their colors are blended automatically; you do not have to pick which one wins.
- 2D, MPR and 3D stay in sync. Showing or hiding a segment in the panel updates all three views simultaneously.