Histogram
Displaying Histogram
The Histogram view plots the distribution of pixel values in an image (or in a selected region), so you can see what intensity ranges are actually present and how they are spread across the available scale. It is also a quick way to gauge the effect of any change made in the windowing and rendering panel: as you move the window / level sliders or pick a different LUT, the histogram visually reflects how the input values are being mapped to the output.
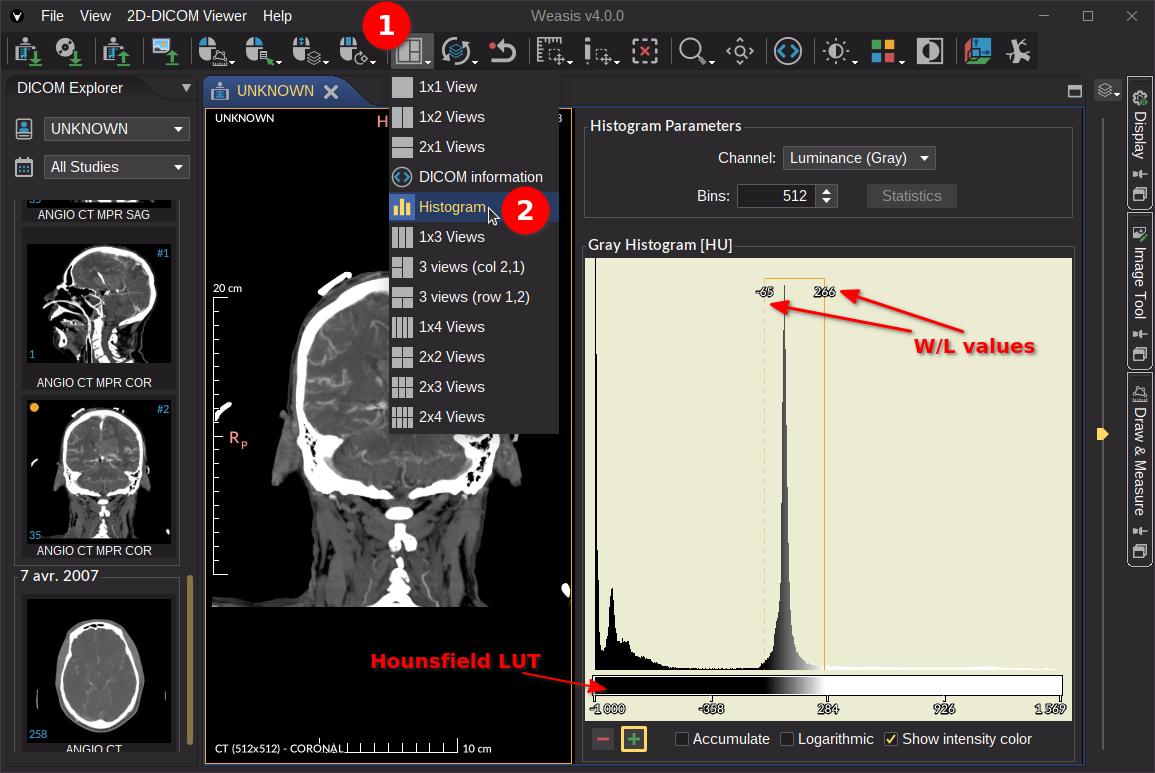
To open the histogram, pick the Histogram layout from the layouts dropdown in the toolbar (see screenshot below).
General histogram parameters
- Channel — for grayscale images, only the Luminance channel is available. For color images, pick one of the RGB, HSV, or HLS color models — each channel of the chosen model gets its own histogram.
- Bins — width of the value intervals grouped together in each bar. The default is computed as
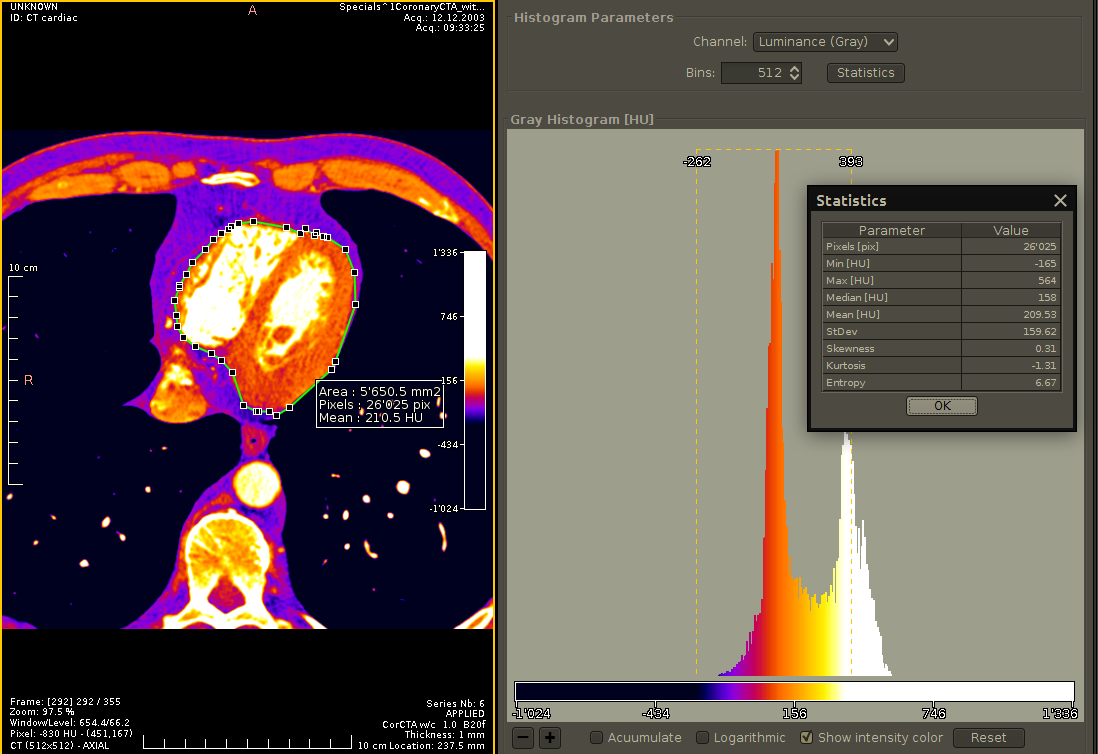
max − minof the pixel values, capped at 512; you can override it with any value between 64 and 4096. - Statistics — show pixel statistics next to the histogram, useful for analyzing and comparing images or regions quantitatively. For the definition of each statistic, see Pixel Statistics.
Note
The X axis values are the modality values (e.g. Hounsfield units for CT) when a Modality LUT applies, or the raw pixel values otherwise. When the modality has a known unit, the unit is appended to the histogram title.
Display parameters
- − / + — shrink or stretch the Y-axis scale (the number of occurrences).
- Accumulate — display a cumulative histogram.
- Logarithmic — show the Y axis on a logarithmic scale (useful when a few dominant bins crush everything else into invisibility).
- Show intensity color — color each bin with the active LUT; otherwise the bars are drawn in black.
- Reset — restore the default display parameters.
Note
A histogram can also be computed on a region of interest instead of the full image: draw a closed shape with the measurement tools and select it to display its histogram (see screenshot below).
Tip
Click any bin in the histogram to display its occurrence count and the modality-value range it covers.